Showing posts with label shares. Show all posts

Friday, 5 February 2016

You - YES, YOU! - should not trade or invest -- EVER!


Howard Bandy is really worth paying attention to.  I'll say that again, in case you missed it:  HOWARD BANDY IS REALLY WORTH PAYING ATTENTION TO.  As he says, "the biggest problem is risk".  You must know what your risk tolerance and survivability is.

In this video interview, he clearly defines why YOU SHOULD NOT TRADE, or invest - YES, YOU!  But the standout bit goes something like this:

You are a keen golfer.  Imagine you see a local golf tournament advertised, $1000 entry with $1,000,000 prize.  It's a single elimination tournament.  You turn up to play, and you find out your first opponent is Greg Norman (insert here any major player here - Tiger Woods, for example).  Swap that over to trading, and your opponent is Goldman Sachs.  There are no challenger tournaments, so your first ever - EVER - trade is against the biggest money on the planet.  It's very difficult...

Ouch!


Wednesday, 10 June 2015

Trading sideways

To a trader on the Zorro (http://zorro-trader.com/) platform:


Hi Sundance

I've noted your pessimism and have held off with my penny-worth.  However, if its any comfort, I also confirm that my account, which went live after some paper trading with Z12, has just been treading water since late April.

I expect the reasons are un-knowable, but of course all traders must endure draw-down.  The test of them, though, is whether they stay the course, and have bomb-proof faith in what they're doing.

My reading around the topic shows how many really successful traders have endured heavy draw-downs, but survived with good cash and risk management.

The markets are currently all in thrall to what central bankers around the world may or may not do, and that isn't helping.  But with Z12 retraining regularly, that should ameliorate the issue.  I firmly believe that Z12 will spring back into life over the next 6 to 12 months.  I say this because my studies surrounding markets led me to this http://www.economicconfidencemodels.com/ by Martin Armstrong (http://armstrongeconomics.com/).  I think the markets are simply going sideways currently.  I'm expecting a return to action during or after the Autumn.

I'm considering bringing Z3 on-line also.  I understand it is not correlated with Z12, and may therefore smooth things out a little.  However, with the bozos in control at the central banks, it may not, as all markets may be currently be in a deathly synchronicity, with cash being the only counter-trend bet!

Tuesday, 4 November 2014

REV Trader Pro - Should it stay or should it go now?

 REV Trader Pro

Should it stay or should it go now?


With apologies to The Clash and their 1982 song, Should I stay or Should I go now.

  1. Introduciton
  2. Balance results
  3. Monte Carlo results
  4. Minimum number of trades simulation
  5. Minimum deposit simulation
  6. Profit factor
  7. Sharpe ratio
  8. GBPUSD with Money Management
  9. Conclusion
  10. Further edits

1. Introduction


REV Trader Pro is an EA that works on MetaTrader 4.  It is the first EA I have purchased for MetaTrader.

I have been evaluating it over the last week, and am typing up my conclusions here as a method of crystallising my own thoughts as to whether I wish to trade with it or not.  If my thoughts are of use to anyone else, then that's good too!

The first thing to note about REV Trader Pro is that its very difficult to do a long term back test on it.  Indeed at the time of purchase, the author hadn't provided any.  His reply to my enquiry why was that, "Because i'm showing live results, back tests are pretty much the same if you run it." (Sic.)

His live results from December 2013 till now may be found here, at myfxbook.com.  Currently they look like this:

Image taken from myfxbook.com
Profit factor is 2.70, and Sharpe Ratio is 0.21.

As I alluded above, back testing is an issue.  To run one for the period January to October 2014 on GBPUSD took 15 hours.  Given that I wished to back test all of the four pairs REV Trader Pro trades from 1993 till now, I reckoned that would take minimally 1635 hours, or at least two and a quarter months.

Clearly this wasn't a good idea, not least as that exceeds the refund policy period, but also that I need my computer during that time!

Then I found a post by Antny on myfxbook.com in which he said that he'd achieved a reasonable back test using the "Control Points" method, rather than the "Every tick" one in MetaTrader back tester.  He further stated that he'd "noticed there was virtually zero difference in the resultant trades."  He also helpfully provided some charts, which at the time of writing are still available on myfxbook.com.

Therefore, using data from AlpariUK, I ran a test to compare January to October 2014 GBPUSD on both methods.  I chose GBPUSD as it seemed to give the best chance of a profitable result, as reported by Batchboy here - myfxbook.com:

Jan to Oct 2014, every tick model
Jan to Oct 2014, control points model
Based on my results obtained in the MetaTrader 4 back tester, shown above, I decided that the similarity was good enough to progress with long term back testing of REV Trader Pro.  In considering this, I also took into account that the data I'd be using runs from 1993.3 to 2014.8, a period of 21.5 years, which I hoped would also serve to smooth out differences.


2. Balance results


I therefore ran individual back tests on the four currency pairs REV Trader Pro is designed to work on, AUDUSD, EURUSD, GBPUSD, and NZDUSD.  I utilised the standard inputs, as provided by REV Trader Pro in the ".set" files for each pair, with only one change: ECNMode=false.  This is because the Alpari account I'm using is a spread bet one, and is not an ECN brokerage account.  These used a fixed 0.5 lot trade.  Using a low fixed lot is generally a good idea in back tests, as anything else can hide dangerous flaws.

I then combined and analysed the results using MTReport 4.0. At a cost $15, this is a tool all traders should have in their box.  For detailed explanations of the charts and tests MTReport generates, see their manual, which you can download without charge here.

The following chart shows the combined results of all four of the currency pairs over the 21.5 year period:
Balance summary 1993 to date, AUDUSD, EURUSD, GBPUSD NZDUSD date intervals approximate

Where the line turns red indicates where the points of maximum relative draw-down have occurred.  Therefore, in the chart above, this is between the two red lines.

This chart begs the question, why the massive 40% down period?  If you'd been trading this over that time, you'd have considered the EA to be broken, or the markets to have evolved - again!  It would be safe to predict you would not have started using this EA again now.

It also seems to show that the authors of REV Trader Pro got lucky.  They started their live results test right at the time the down period ended, when a major upturn seems to be in place.

This doesn't look like real consistency.  How would we know if we were in an extended draw-down period, or just a blip?

The next four charts show the results for the individual currency pairs:
Balance summary 1993 to date, AUDUSD date intervals approximate
Balance summary 1993 to date, EURUSD date intervals approximate
Balance summary 1993 to date, GBPUSD date intervals approximate
Balance summary 1993 to date, NZDUSD date intervals approximate

These four charts tell different stories, with some commonality:
  • broadly, the balance in all four has been increasing in 2014, coinciding with the test period published by the authors;
  • AUDUSD and EURUSD have been largely sideways trading over the 21 years;
  • NZDUSD has been a loss for fourteen of the the last 21 years;
  • GBPUSD has been the only consistent winner, with only a minor balance down-trend in 1995, when it made its maximum relative draw-down.

3. Monte Carlo results


Monte Carlo simulation AUDUSD, EURUSD, GBPUSD NZDUSD
  • Perfect - in only 11.2% of the simulated outcomes does the balance remain above the initial deposit;
  • Error rate - 1.2% is low, since the simulations were based on 5000 days;
  • Risk of ruin - there is an 80.7% risk of incurring 15% draw-down;
  • Draw-down - 15.1% is the average draw-down;
  • Deviation - a measure of the distance between the maximum and minimum balance for all trades, 124.5%;
  • Profit/trade - the calculated average profit per trade;
  • Balance - the average ending balance of all the simulation runs, £2478;
  • Return - the average return percentage for all simulation runs, 147.8%.
Let's contrast this with the same for GBPUSD only:
Monte Carlo simulation GBPUSD
And now, using the GBPUSD back test results which produced the Jan to Oct 2014, every tick model balance/equity chart at the start of this article:
Monte Carlo simulation GBPUSD
GBPUSD looks more inspiring.  The combined result, trading as per REV Trader Pro, doesn't.


4.  Minimum number of trades simulation


This MTReport tool indicates the minimum number of trades needed before the return will exceed the draw-down experienced:
  • GBPUSD = 1
  • NZDUSD = 13
  • EURUSD = ~ (stopped after 320, which could equate to around 3.8 years)
  • AUDUSD (failed to provide any data - average profit from trade is negative)
GBPUSD is in the lead.

5.  Minimum deposit simulation


This MTReport tool indicates the minimum deposit you'd need to maintain in an account to safely trade REV Trader Pro against each of the four currency pairs:
  • GBPUSD min. deposit =624
  • NZDUSD min. deposit = 8226
  • EURUSD min. deposit = 9053
  • AUDUSD (failed to provide any data - average profit from trade is negative)
Again, GBPUSD is in the lead by a country mile.

6.  Profit factor


Profit factor = gross profit / gross loss:
  • GBPUSD
    • Gross profit = 25257.03
    • Gross loss = 17687.91
    • Profit factor = 1.43
  • AUDUSD
    • Gross profit = 9658.94
    • Gross loss  = 10519.23
    • Profit factor = 0.92
  • EURUSD
    • Gross profit = 22976.81
    • Gross loss = 22908.66
    • Profit factor =1.00
  • NZDUSD
    • Gross profit = 17804.82
    • Gross loss = 17220.43
    • Profit factor =1.03
...and guess what?  GBPUSD again.
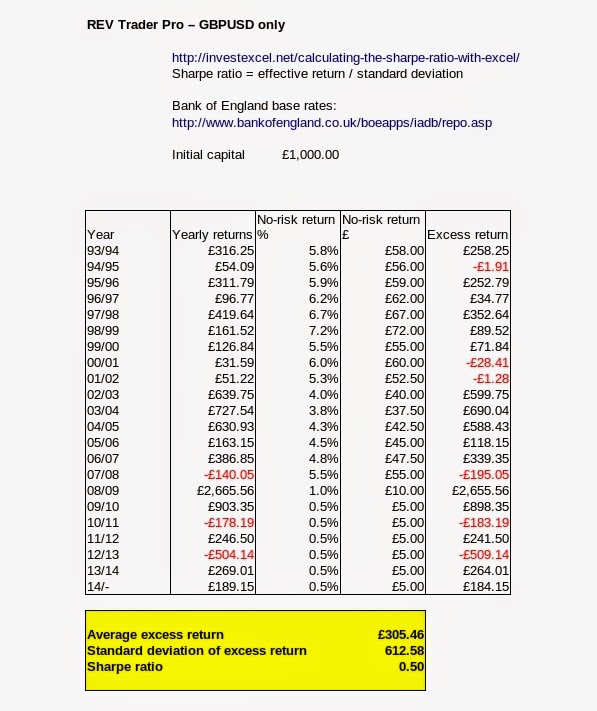
7.  Sharpe ratio


No surprise that the Sharpe ratio for GBPUSD by itself is better than all four pairs traded.  A Sharpe ratio of nearer 1 is always the goal.

8.  GBPUSD with Money Management


Trading GBPUSD only, and using the Control Points model, risking 3% per trade.

Jan to Oct 2014 data - Balance, GBPUSD only
Jan to Oct 2014 data - Monte Carlo simulation, GBPUSD only
The minimum number of trades needed before the return will exceed the draw-down experienced remains at 1.

The minimum deposit to maintain in an account to safely trade GBPUSD reduces to 551.

Profit factor using this profile is now 1.58.

Sharpe ratio = 0.32.

9.  Conclusion


REV Trader Pro seems to promise a lot.  But I'm not convinced of its longer term delivery.

When trading a system I would expect it to be robust over the long term.  How does one discern between a permanent or long-term breakdown of performance and short-term draw-down?  I don't think REV Trader Pro has proven its case here.

In addition, I don't understand the inclusion of AUDUSD, EURUSD, and NZDUSD.  Yes, they seem to be in a short-term up-trend, but if my history data is correct, that will end sometime soon.

REV Trader Pro seems to be one of the more expensive EAs to buy.  I'm not convinced it will meet expectation.

Even increasing the initial deposit from 1000 to 5000, and trading 3% risk in the money management section of the EA, there is no marked improvement in performance:

REV Trader Pro, Jan to Oct 2014, GBPUSD only, 3% risk in money management

I'm going to ask for a refund under the 60 day guarantee.

Then I'm going to see if I can design a GBPUSD EA myself using the excellent fxDreema.  Highly recommended.  A non-programmer's delight, well worth the $95 annually.  There are shorter periods too, e.g., monthly at $19, or free for an unlimited reduced functionality trial - and no, I don't get a commission!


I consider this the best of its kind on the market.  If you are serious about trading, get your hands dirty without actually having to fully understand MQL4/5.

10.  Further edits

4 Nov 2014, 18:14 GMT
Useful feedback from John on eareview.net suggested I'd missed something:
John
...have you ever considered that the vendor optimizes it every year? Your using settings, that you hope will work for 20 years, is kind of naive and ridiculous. The markets always change and REV Trader PRO is clearly designed for the recent market of about past 2 years maybe longer. And I”m sure the vendor will provide updates further along.
Me
Yes. True, and I should have said that. I’d rather rely on me being around for 20 years to optimise my own EA, than relying on someone else. After all, the vendor’s interest in me only extends to the initial sale.
There again, the vendor’s current setting for GBPUSD *have* lasted for 20 years, and it is the GBPUSD pair that REV Trader Pro seems to rely on for profits!
So, with due respect to you, I think I’ll keep to my opinion. But thank you for the comment. I’m going to include it in my text.

Tuesday, 30 September 2014

...for whom the bell tolls...


No man is an Iland, intire of it selfe; every man is a peece of the Continent, a part of the maine; if a Clod bee washed away by the Sea, Europe is the lesse, as well as if a Promontorie were, as well as if a Mannor of thy friends or of thine owne were; any mans death diminishes me, because I am involved in Mankinde;
And therefore never send to know for whom the bell tolls; It tolls for thee.
John Donne, Meditation XVII, 1624
 

They say that no-one rings a bell at market tops or bottoms.  I'm beginning to think that this may not be completely accurate.

That said, my white crash-alert flag of surrender is well and truly tattered.  Its been buffeted and trampled on so firmly by a huge bull run, that I've been tempted to take it down, and admit I was wrong.

But then along comes Alibaba.  My saviour!

Shares in Alibaba rose 36% on the first day of trading; therefore its P/E is 61.  And lest we forget, those shares are not really holdings in the underlying company, but are actually holdings in a "variable interest entity".  Understand that?  Nor me!  But basically, the Chinese government has disallowed overseas shareholders from holding proper shares.  To cap it all, governance has been questionable, with Jack Ma, Alibaba's founder, allegedly pulling a fast one in 2010 with Alipay.

Have we entered the "irrational exuberance" stage of the bull?  Maybe.  When the retail investor starts piling in we'll know for sure.  Whether this is the start point, only hindsight will tell.  An investor has three options, go long (buy), go short (sell), be out (sit in cash or near-cash holdings).

I'm keeping the latter topped up.  What goes up, also comes down.  When it comes down, that's when opportunities present themselves.

Friday, 19 September 2014

Scotland's indepencence vote - a civil "war"

I voted "no" to independence yesterday, 18th September.  But not because I don't think Scotland could be independent.  Here's why:

I've said it again and again over the last few years: There is no reason why Scotland should not be independent.  There are plenty of examples worldwide of small and prosperous nations - Switzerland, Singapore to name but two.  But the Scottish Nationalist Party is socialist; indeed, I believe it harbours communists.  One of its most famous communists was the poet Hugh MacDiarmid who wrote some wonderful poetry in the Scots language (not Gaelic), and I believe quite a number of the Scottish Nationalist Party (SNP) have quietly continued to adhere to his views.

I know of no instance of a socialist society that has also been prosperous in the long term.  Arguably the greatest thinker and economist of any time from any part of the world, a Scot, Adam Smith, born in Kirkcaldy, lived Edinburgh, said that profitable societies work due to the "invisible hand" of commerce being allowed to operate freely.  In a nutshell, we all do what we need and want to do, and by and by everything humanity needs and desires is produced, developed, designed, implemented.  This is Capitalism.  It seems to me that this is largely how the USA worked up till the turn in the 1990's, with a few hiccups along the way.  Its what made her a superpower.

Socialists, on the other hand, meddle, fudge, build ever bigger government (the US is now in a socialist trend - Obamacare, for example), get into more and more debt, build ever bigger government to hunt down ever more money to pay for their experiments - a vicious circle.  It doesn't work.  The Englishman, Thomas Paine, probably the most enlightened revolutionary who ever lived said, "Society in every state (of being) is a blessing, but government even in its best state is but a necessary evil; in its worst state an intolerable one...".  With his support and writings, George Washington roused and inspired a rabble of cold, wet and hungry farmers to stand up to the biggest empire the world had known up to that time, and kick it out!  Good riddance!  Paine was and is right!

I voted against the intolerable evil of big, socialist government - not against the idea of independence per se.

So why do I say that Scotland is now in a civil "war"?  Simply this; nearly half of the population seems to want one thing (55%), the other half the opposite (45%).  Or that's what they think.  I really don't believe most Scots have drawn the distinction I have between Socialism and bigger government on the one hand, and prosperity with independence on the other.  There will be a price to pay for this, and Alex Salmond and the SNP will be blamed by history for the troubles to come.  However, the SNP is really only symptomatic of a greater trend; the loss of confidence in governments across much of the world, and the backlash against the corruptness of it all.

There will be a reckoning.  Investors will struggle to find safety for capital, let alone a return.  The situation will only favour traders, but a good many of them will loose their shirts, too.

Can I take heart from the fact that the overall turnout to vote was a staggeringly high 85%?  Are Scots democrats?  Or, as some commentators have said, did they really just vote for their pensions and self-interest?  I really don't know, but they couldn't be blamed for it.  But I do know that how it plays out won't be predictable or especially pleasant.

How depressing.

Friday, 12 September 2014

What's GDP - really?

"...lies, damned lies, and statistics."


Wikipeadia (so it must be correct!) says,

The term was popularised in the United States by Mark Twain (among others), who attributed it to the 19th-century British Prime Minister Benjamin Disraeli (1804–1881): "There are three kinds of lies: lies, damned lies, and statistics." However, the phrase is not found in any of Disraeli's works and the earliest known appearances were years after his death. Other coiners have therefore been proposed, and the phrase is often attributed to Twain himself.
So, why am I using the above quotation to describe GDP  (Gross Domestic Product).  Well, consider this:

I cut your lawn.  In return, you mow my lawn.  No monetary payment is made.  No effect on GDP.

I cut your lawn - you pay me £1. You mow my lawn - I pay you £1. The GDP goes up. The more transactions per person per year, the greater the GDP of a country.  But neither of us is wealthier.  The transaction left us exactly where we were, but the statisticians employed by government can rejoice!  GDP went up!
What is GDP really measuring?  Increased productivity, or output, or profit?  You tell me; I really don't know!

Tuesday, 25 February 2014

How to save and invest the easy way

"Save and invest" is the pearl of wisdom I try to impart to my daughter, god children, nieces, and anyone else with a vague interest in listening to me!  Admittedly the list of listeners is very short, and doesn't include most of the above - let alone anyone else!

Anyway, here goes: How to save and invest the easy way.

The mantra of investment is "buy low, sell high".  It sounds easy, but due to human nature, it isn't.  Most of us do not have time, and even less confidence to stock pick.  Most of us fall into the retail investor's trap of following the crowd.  All of which means that a depressingly high number of people end up doing the exact opposite of "buy low, sell high"!

So, here's a suggestion I gathered from "MoneyWeek" recently, and adjusted slightly, thus:

  1. Allocate a final sum to invest.
  2. Because tops and bottoms of markets cannot be judged, place say 10% of this final sum over some time, say 5 to 10 months.
  3. Review annually or 6 monthly.
  4. Suggest using funds listed in “The profits on the middle ground” article instead of just the Vanguard UK Equity Index Fund.
  5. Suggest holding some gold in physical form locally as well as ETFS Physical Gold.
 ________________________________________________________________________________
BUILD A 'BUY-AND-FORGET' PORTFOLIO
by Phil Oakley
"MONEYWEEK"  6 September 2013  www.moneyweek.com

If I could give just one piece of investment advice, it would be this:
investing should be as simple as possible. You want a strategy that is
cheap – so you don’t waste money on costly managers or complex
products – and low maintenance, so you can get on with the important
things in life. This is exactly what American financial adviser
Harry Browne tried to design with his ‘Permanent Portfolio’. Having
lived through the awful environment of the 1970s, he wanted to create
a portfolio that could cope with whatever the world threw at it – recessions,
inflation, deflation – and also make decent money when times were good.
He wrote about it in 2001 in his book "Fail-Safe Investing: Lifelong
Financial Security In 30 Minutes".

The portfolio is split into four equal parts: a quarter in US
stocks, a quarter in US Treasury bonds (government debt), a
quarter in cash, and a quarter in gold. By holding just those four
assets, Browne reckoned that most investors could achieve their
financial goals with far less worry than most other methods. An
event that hits one bit of the portfolio should be good for one
or more of the other parts. And because each accounts for only
25% of the portfolio, no single disaster can devastate the whole plan.

Shares provide decent returns in good times. Bonds also tend to do
fairly well when the economy is calm and growth steady. Recessions
or deflation (falling prices) are bad for shares, but good for
high-quality bonds and cash, because their buying power increases.
Periods of high inflation, meanwhile, are bad for bonds but good for gold.

It’s simple to run too. At the start of each year the portfolio
is spread equally across the four asset classes. At the year-end it is
rebalanced back to equal weightings (25% in each investment).
So if an investment does well during the year, and ends up
accounting for more than 25%, the investor takes some profit and
reinvests it in an area that had performed less well.
This automatically means ‘selling high’ and ‘buying low’, whereas
many investors do the precise opposite, chasing rising,
expensive assets and avoiding falling, cheap ones.

Much of this is now conventional wisdom. A 2012 paper from asset
manager Vanguard backs up earlier studies that say that investment
returns come mostly from the assets you own, rather than the shares
you pick, or when you buy or sell. And spreading your money across investments
that behave differently to one another (are ‘non-correlated’, in the
jargon) is one of the best ways to reduce your risks. But
how does it do in practice?

In their book on Browne’s Permanent Portfolio, Craig Rowland and
JM Lawson found that, between 1972 and 2011, it delivered annual returns of
9.5% if rebalanced each year, or 8.8% if left alone. That may not seem
like a big difference. But over 39 years, the rebalanced portfolio only
lost money in four years, with a maximum annual loss of just 4.9%. The
other portfolio lost money in 11 years, with a maximum loss
of 21.6%. I know which I’d rather own.

So how would Browne’s strategy have worked for British investors?
I crunched the numbers and the answer is ‘very well indeed’.
Between 1983 and 2012, the Permanent Portfolio returned 8.34% a year,
compared to 12.53% for the British stockmarket.

You might be wondering: how is that impressive? Well, during the 30
years up to 2012, it’s true you’d have made more in the stockmarket.
However, you’d also have taken on much more risk. Indeed, the
risk – as measured by the standard deviation (SD – how much returns
bounce around their average levels) – was more than three times
higher for the stockmarket alone.

    1983-2012                         Annual returns         Risk (SD)
    Permanent Portfolio          8.34%                       5.01%
    British stockmarket          12.53%                     16.3%

What does that mean in practical terms? Well, the Permanent Portfolio
only lost money in two of the 30 years, with the
biggest annual loss being 2.53% in 2001. Remember this is during a
period when the British market saw epic crashes in 1987, 2001, and 2008.
And between 2003 and 2012 (as shown below), a permanent portfolio has
not only involved less risk than stocks alone, but also higher returns.

    2003-2012                          Annual returns         Risk (SD)
    Permanent Portfolio           8.35%                       3.34%
    British  stockmarket          6.8%                         16.6%

Of course, short-term performance can be very variable. And so far,
2013 has been a poor year for the Permanent Portfolio.
Interest rates on cash are tiny and bond and gold prices have
fallen sharply. However, that rather proves the point –
this is a ‘buy-and-forget’ portfolio, not one to tinker with every other day.

HOW TO FOLLOW THE STRATEGY
If you like the strategy, it is cheap and simple to set up and
run. One approach for British investors is to put the 25%
cash component of your money in a savings account; 25% in
the Vanguard UK Equity Index Fund (a fund that tracks the UK market);
25% in the iShares UK Gilts ETF (LSE: IGLT); and 25% in the ETFS Physical
Gold (LSE: PHAU) exchange-traded fund. You then forget about these
investments until the end of the year, and then rebalance each back to
25% of the total portfolio value.

 ________________________________________________________________________________

THE PROFITS ON THE MIDDLE GROUND
By: David C Stevenson
"MONEYWEEK"  8 October 2013  www.moneyweek.com

Last time, I risked your wrath with the horrible technical term ‘smart beta’. I’m sure that more than a few of you felt your eyes glaze over, and found the thought of advanced root canal work suddenly more appealing – but my use of the jargon was in a good cause!

Investors can increasingly use easy-to-trade, low-cost, exchange-traded funds (ETFs) as an alternative to active fund managers (the ‘beta’ bit) – but in a rather clever way that helps to control risk in a portfolio (the ‘smart’ bit).

To repeat the key point from last time: in the past, actively managed funds charged you higher fees for picking stocks, rather than just tracking a benchmark. Their aim was to deliver better returns while taking less risk.

This was achieved by using a specific investment strategy, or ‘style tilt’. For example, the manager might only buy stocks with a high dividend yield, or those with robust balance sheets.

Smart beta does this too, by following systematic rules to pick stocks with specific attributes. Better yet, it does this at a lower cost, and without any of the behavioural flaws fund managers are prone to.

For example, those poor bullied active managers might be under pressure from their bosses to conform to market behaviour, and may change how they run the fund over time.

So smart beta offers a middle ground between traditional passive funds and active management.

But what to buy? I have three suggestions this week. The first is for the more value-orientated among you (those who like to buy good-quality equities at a decent price).

I’d focus on the fundamental indices devised by Rob Arnott and Jason Hsu of US-based Research Affiliates, and in particular the Powershares FTSE RAFI UK 100 ETF (LSE: PSRU).

RAFI were the first players in the fundamentals-driven, smart-beta revolution and, when it comes to value investing, they are still probably the best, bar Andrew Lapthorne over at Société Générale.

RAFI uses four fundamental measures of company size: book value, cash flow, sales and dividends. It weights its indices based on these fundamentals. So the stock with the highest fundamental value gets the biggest weighting, while the one with the weakest fundamental value gets the smallest.

According to ETF whizz Simon Smith, of www.etfstrategy.co.uk, you get a portfolio, “which, when compared to a market-cap-weighted equivalent, underweights overpriced stocks and overweights undervalued stocks”. This portfolio tends to tilt towards both value stocks and small-caps.

Better yet, says Smith, “when value stocks are out of favour and thus are cheap, the strategies tend to increase their allocation to deep value stocks. When value is in favour, the value tilt is much milder because these stocks tend to be priced higher. Rebalancing into unloved stocks and out of the most popular stocks is… essentially a contrarian strategy.”

Be aware that there are some potentially big disadvantages: the portfolios can become concentrated in a few large positions, while overvalued stocks can also become overweighted during different stages of the stock-market cycle.

But overall I think the RAFI indices are first rate, and I’d highly rate their emerging markets variation too: Powershares FTSE RAFI Emerging Markets (LSE: PSRM).

Those who are more adventurous and want to invest in firms that are cheap and growing at a decent rate should look at First Trust UK AlphaDEX (LSE: FKU).

First Trust’s highly successful AlphaDEX strategy, which has been around in the US for a while, aims to take the best of both value investing and growth investing (ie, stocks with fast-growing profits).

According to First Trust, the index screens UK stocks for “growth factors including three-, six- and 12-month [share] price appreciation, sales to price [ratio] and one-year sales growth”. It also looks separately at “value factors, including book value to price, cash flow to price and return ona ssets”.

What it boils down to is that you get the best of all worlds – decently valued stocks with solid earnings growth. Last time I looked in the summer, that meant a weighting towards the likes of budget airline easyJet, equipment rental group Ashtead and housebuilder Barratt.

Last but not least comes the Ossiam ETF FTSE 100 Minimum Variance ETF (LSE: UKMV).

The ETF has consistently beaten its peers since its launch in January 2012. It aims to deliver the return from the FTSE 100, but with reduced volatility.


In technical terms, the index picks and weights stocks based on their forecast risk and inter-correlations to build a lower-risk portfolio. In practice, you end up with an index that is less exposed to volatile stocks such as energy and mining stocks (plus banks), and more exposed to industrial goods and consumer companies.

In short, you end up with a more defensive index tracker focusing on British stocks you know and love, but in a cheap, cost-effective wrapper.

Thursday, 31 May 2012

Stock screening and picking - “Monkey with a pin” style

A little time ago I read Pete Comley’s excellent -and free! - ebook, “Monkey with a pin”.  You can get it here (http://monkeywithapin.com/), and in addition he has released it in audio form, again free.  He deserves thanks and praise for this effort.

I think every investor should read it (see my post on here, “I thought I was an OK investor, now I know I'm not”, 17th May 2012).

Now that I’ve had a little time to think about it, I think a way forward might be this:
 
  • Choose an amount you wish to put into the market (say £1m over 10 years), and then how much you will invest every month to achieve this (in this case, £8,340 per month).

  • From the world’s stock markets find companies that match the following screener:

Zero debt.
At or near a 52 week price low.
Yield 3.5% or greater - consistently (i.e. over, say, 10 years or more).
Consistently generates free cash flow, every year (i.e. the company has money left over after meeting all its obligations - its defined here: http://www.moneyweek.com/investment-advice/glossary/f/free-cash-flow). (See video here: http://www.moneyweek.com/freecashflow).
Isn’t a “small cap” (i.e. with a market capitalisation of less than $1bn US or around £700 million).
 
  • Then do a randomised pick of the resultant list of the above.
I suppose one would use the stock exchanges of London, Japan, US, Europe (Berlin, Paris, etc.), and far east (Singapore).  Choose a broker with a good global spread.
As long as you don’t breach the 3% rule, you can invest in an individual stock as often and as regularly as the randomised picking system instructs you to.
 
  • Benefits:
Pound cost averaging - i.e., smooths out the highs and lows in the markets.
Market top or bottom agnostic (ignore the news!).
Takes little time, probably just an evening a month, after you’ve set up your screening and spreadsheets.
Entirely “mechanical”.  Your emotions won’t get in the way of making stock picks, and emotions are a big problem for stock pickers.
Simplicity.
 
  • Rules:
Don’t trade (i.e. buy or sell on news).
Keep holdings for the long term (more than 3 years).
Be disciplined, and don’t fall to temptation.
Ignore “gurus” and tipsters.
No stock holding to exceed 3% of your overall initial pot (in this case £30k, or 3% of £1m).
If the screen of the above brings up nothing, or just ones you are fully invested in, then don’t invest this month, and hold your cash pot over till something comes along.  In other words, be patient!
Stick to the rules!

I have not tested this method, it is just a theory, and I have no results to show for it.  However, I have read extensively elsewhere regarding making stock picks, and this one seems to me to be as good as any.

Wednesday, 23 May 2012

How Money Dies

"We can guarantee cash benefits as far out and whatever size you like, but we cannot guarantee the purchasing power."

So said former Chairman of the Federal Reserve, Alan Greenspan, 1 minute 50 seconds into this video.

Give this a moment's thought, and you'll realise he is talking about inflation, or even hyper-inflation.  What have we had for the last goodness knows how long?  Inflation.

Here's an example.  Over the weekend my wife and I replaced a rose that had died.  At the base of the old rose was it's name tag, with a price of £3.30.  The cost of the replacement?  £16.00.  The difference in time? About 20 years.

The video talks mainly about the US Dollar, but it applies to the Pound Sterling, Euro, and all other debt based fiat currencies.

Monday, 21 May 2012

Optimism is an investor's enemy


Optimism is probably one of humanity's greatest traits, but an investor needs to be wary of it.  If you think something is worth investing in, think again before you do so.  I thought this video from TED summed up the issue.  Click this link to watch it:


Thursday, 17 May 2012

I thought I was an OK investor, now I know I'm not


I thought I was an OK investor, now I know I'm not; I just got lucky.

Pete Comley's book is free and excellent.  Even if you are not new to investing, there is much that will surprise you.  In any event, I feel sure you will want change something about how you invest.

The book is written with the UK investor in mind, but in fact has lessons for all.

I may have further thoughts after digesting this book.  For now,  follow this link to download his book:

Monkey with a pin

Wednesday, 25 April 2012

Hello investors

thocht n. Thought. Anxiety, care, trouble, a cause of concern or anxiety, a burden, worry.
dim. thochtie A thought, an idea. A very small amount, a very little, of a substance, time or distance etc.
twa n. Two.
Source: My head, confirmed by http://www.scots-online.org/dictionary

Twa Thouchties is my take on the global scene of investing, seen from a parochial Scottish viewpoint.  It isn't much, but its mine.  I offer no personal advice or explanation; I just say what I've done.  Occasionally I might voice an opinion, concern or other, or even a response to something or someone.  Time will tell.  That's all.

Why the name?  "Twa" as I don't have too many; "Thochtie" as invariably they are small ones.

Regards,

James.